Eye Sight Charts: How Are They Different?

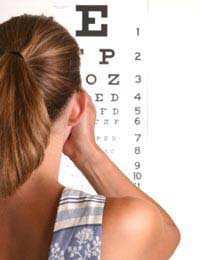
When you have your eyes tested at the optician, you are probably too busy concentrating on reading the letters to take too much notice of the chart. The typical visual acuity chart used starts with a large single letter, then fewer letters in each row that get smaller as you read down the chart. The bottom line has tiny letters. This is called a Snellen chart, named after the doctor who invented, Dr Hermann Snellen, back in the 1860s.
The Snellen Chart and Visual Acuity
The letters on the chart are more correctly known as optotypes and each row on the chart corresponds to a particular visual acuity. So, for someone with perfect eyesight, it is no trouble to read row 8 while standing 20 feet from the chart – this is then described as a visual acuity of 20/20, which is where the saying 20/20 vision comes from. If someone can just read the top large letter, they have a visual acuity of 20/200, which is about the limit of legal blindness.Problems with the Snellen Chart
The Snellen chart is very convenient and is still considered very useful for routine eye tests but it does have some important shortcomings that limit its use in clinical trials. The first is that the number of letters per line; the Snellen chart has variable letter sizes and also variable numbers of letters in different lines. It is therefore possible for someone with poor vision to be given a score that differs by a whole line simply because they are unable to read one or two letters.The Snellen chart also has an irregular progression of letter sizes between lines and the letters are not always equally legible. This makes it more likely to people with poorer vision to be given an artificially high score of visual acuity. The distance between the letters is also not standard; some letters are more crowded than others, which brings in another source of error. Finally, Snellen charts themselves are not all the same – different Snellen charts from different manufacturers have different fonts, letters, spacing ratios and they may be projected or illuminated differently. All of these limitations make the Snellen chart not really suitable for assessing small changes in visual acuity and it is not often used to compare groups of patients in trials of new eye treatments because it simply isn’t accurate enough.
Clinical Trial Visual Acuity Charts
Since the 1980s, a new type of chart called the EDTRS chart has been used in clinical trials. At first glance, an ETDRS chart looks similar, but then you notice that the lines all contain the same numbers of letters – usually 5. The size of the letters decreases as you go down the chart but the spacing and the size of the letters on individual lines is much more uniform. This type of chart allows much more accurate measurements of visual acuity over time, so the progress of individual patients can be assessed more easily.Charts for People Who Cannot Read
One important assumption when using either the Snellen or ETDRS chart is that people are literate and recognise English letters. Such tests are no use in very young children, people who cannot read people who cannot read English and people with learning difficulties or conditions such as dyslexia. Many different visual acuity charts have now been developed to overcome this problem – using pictures for children and those who are illiterate, using Arabic or other scripts, or by using traditional cultural symbols. One of these, developed in Australia, uses the traditional aborigine symbol of a turtle, which is in different orientations with slightly different markings in the rows, instead of letters.Other Vision ChartsAs well as using charts to measure visual acuity, there are also charts to assess how much contrast people can still see. In these, the letters are all the same size but they get paler as you go down the chart. Someone with poor contrast sensitivity will only be able to make the black letters, and will fail to see the greyer letters further down. A grid with a dot in the centre is also used to assess if someone is in the early stages of age-related macular degeneration. If a normal person holds the grid in front of their eye and focuses on the central dot, the grid looks normal. If someone with a developing eye problem does the same, the grid looks distorted and wavy.
These charts are used as indicators that something serious may be wrong – and usually lead on to further tests before a diagnosis is made and treatment begins.